Description
Key Features:
- Data Cleaning: Automatically tidies up and enhances data.
- Chart Generation: Creates various chart types with explanatory insights.
- AI Insights: Provides AI-assisted, easy-to-understand insights and forecasts.
- User-Friendly Interface: Suitable for both beginners and professionals.
Benefits:
- Time-Saving: Automates data cleaning and visualization.
- Educational: Guides users with descriptions and key takeaways for each chart.
- Versatile Applications: Suitable for business, research, education, and more.
Target Audience:
- Students and Educators: Simplifying data analysis and enhancing learning.
- Businesses: Making data-driven decisions quickly.
- Researchers: Exploring and visualizing data without coding.
Use Cases:
Problem Statement:
Analyzing and visualizing data can be complex and time-consuming, often requiring advanced skills in data manipulation and visualization tools.
Application:
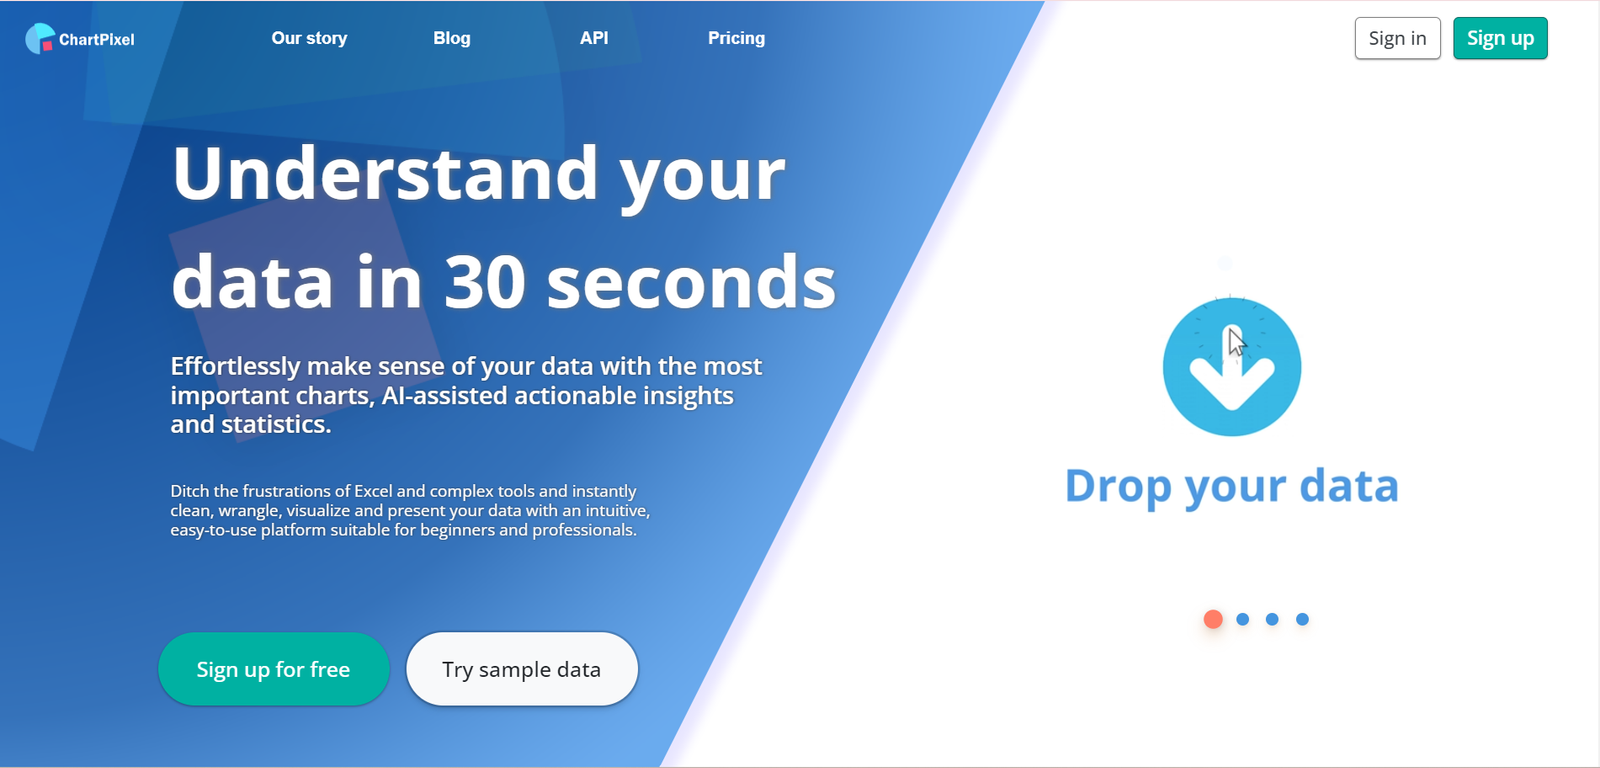
ChartPixel is a no-code platform that allows users to quickly generate charts and actionable insights from various data sources. It simplifies the data analysis process by automating data cleaning, visualization, and insight generation, making it accessible to users of all skill levels.
Outcome:
Enhanced productivity, faster data analysis, and improved decision-making through intuitive and easy-to-understand visualizations and insights.
Industry Examples:
- Marketing: Visualize campaign performance.
- Education: Analyze student performance data.
- Healthcare: Track patient outcomes and trends.
- Finance: Visualize financial data and forecasts.
- Retail: Analyze sales data and customer trends.
Additional Scenarios:
- Non-profits: Visualize donor and fundraising data.
- Real Estate: Track property market trends.
- Travel: Analyze travel patterns and preferences.
- Entertainment: Visualize audience engagement metrics.
- Manufacturing: Track production and quality metrics


Reviews
There are no reviews yet.